
Alerts. It can be the word that induces anxiety in some, or a sense of comfort for others. In modern technology, you cannot have reliable systems without alerts. The challenge is creating meaningful alerts. And with any architectural decision, the most prudent choices are made from understanding an organization’s intents and direction.
While it’s difficult to do a full audit, there are some basics that almost every organization should want. The biggest one is if a crucial system goes offline. For many organization, this is a virtual machine–particularly if it’s hosting an application. To get started, we need to understand a few things.
Alerts are stacked on top of KQL queries. If you do not understand KQL, I would do a little basic research to understand what’s happening with the syntax. To start playing with the language head to Azure Resource Graph Explorer: https://portal.azure.com/#view/HubsExtension/ArgQueryBlade .
There are quite a few canned queries available. If you’re familiar with the concept of resource providers, this should look familiar.

I was recently working on a project looking for orphaned disks in Azure–disks that were no longer attached and were not deleted properly. While you can do this with PowerShell, the beauty of Resource Graph is it’s subscription agnostic. If you have multiple subscriptions, you must switch between them in PowerShell. Resource Graph queries the entire tenant. No switching necessary.
Here’s an example query to find all unattached disks:
Resources
| where type has “microsoft.compute/disks”
| extend diskState = tostring(properties.diskState)
| where managedBy == “”
or diskState == ‘Unattached’
| project id, diskState, resourceGroup, location, subscriptionId
So, what’s actually happening here? I’m not going to deep dive into KQL right now, but one very important concept is tables. If you’re in the Azure portal, you’ll notice there are two tabs: Categories and Table.

When we begin a query, we have to pick a Table where logs are being stored. Resource Graph keeps track of all the changes made in your environment; you just need to know where to look and what to ask. This query is asking the Resources table for information. If you expand resources and look at scroll down, you can see a wealth of sub-tables and properties.

If you keep scrolling, you’ll see “microsoft.compute/disks”, the resource provider we are looking for. And you’ll notice, we’ve added a filter specifically for that resource type in our query.
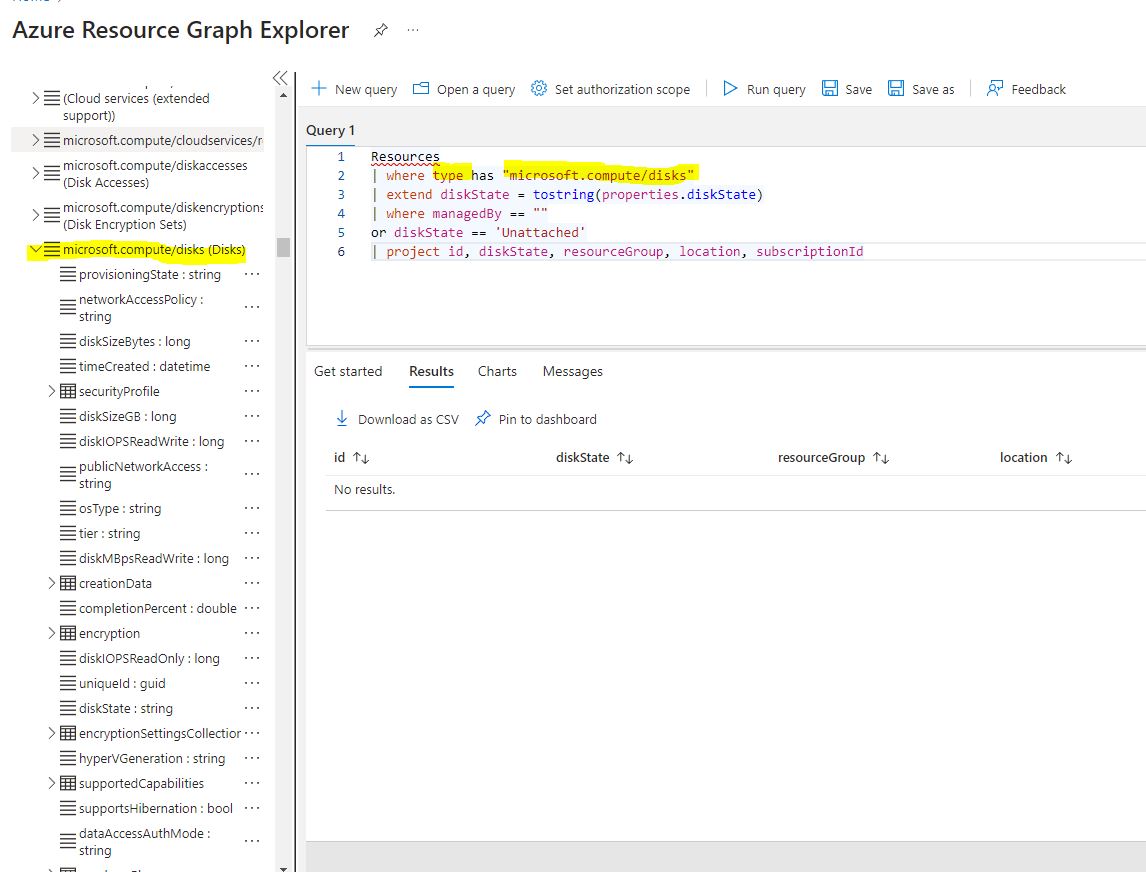
Since I’ve already done the disk cleanup, there are no results. But if you notice the properties on the left under the resource provider, these will coincide with the results for individual items.
There are two additional steps after this to setup proper log traffic. If you do not have a Log Analytics WorkSpace setup, please do that. Also, you will need to export subscription traffic to that Log Analytics WorkSpace. I’ll show where that is in the portal.
Go to Subscriptions > Select a Subscription > Activity Log. You need to “Export Activity Logs”, and “Add Diagnostic Setting”.

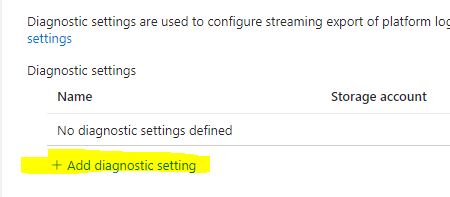
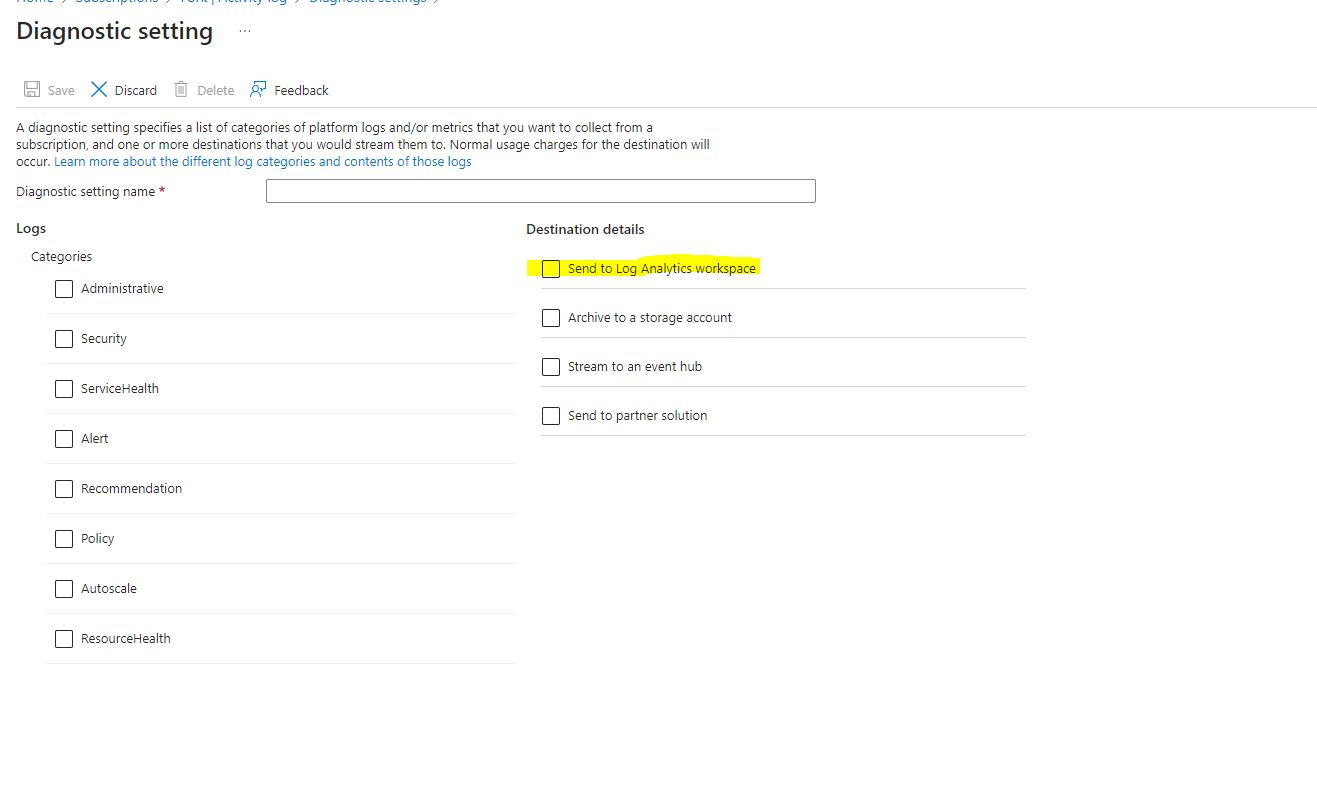
From here, select the categories you want to export from the subscription. Then select “Send to Log Analytics Workspace.” Since we are looking to stack alerts, we want the log info to go there–this is also important for Azure Sentinel. Once you select Log Analytics Workspace, select the subscription and Workspace you want to export to.

Once completed, you’ll see your entry under “Diagnostic Settings”.
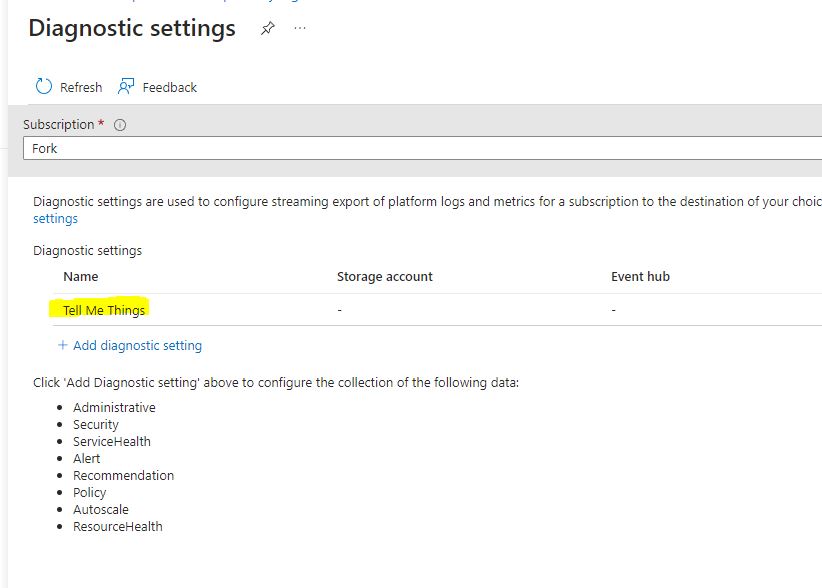
We now have log flow to our Analytics WorkSpace. Let’s head over there and start writing some alerts.
First thing, select logs. Then change your scope to the subscription level. This can be refined later–especially if you want to work on just a production resource group.
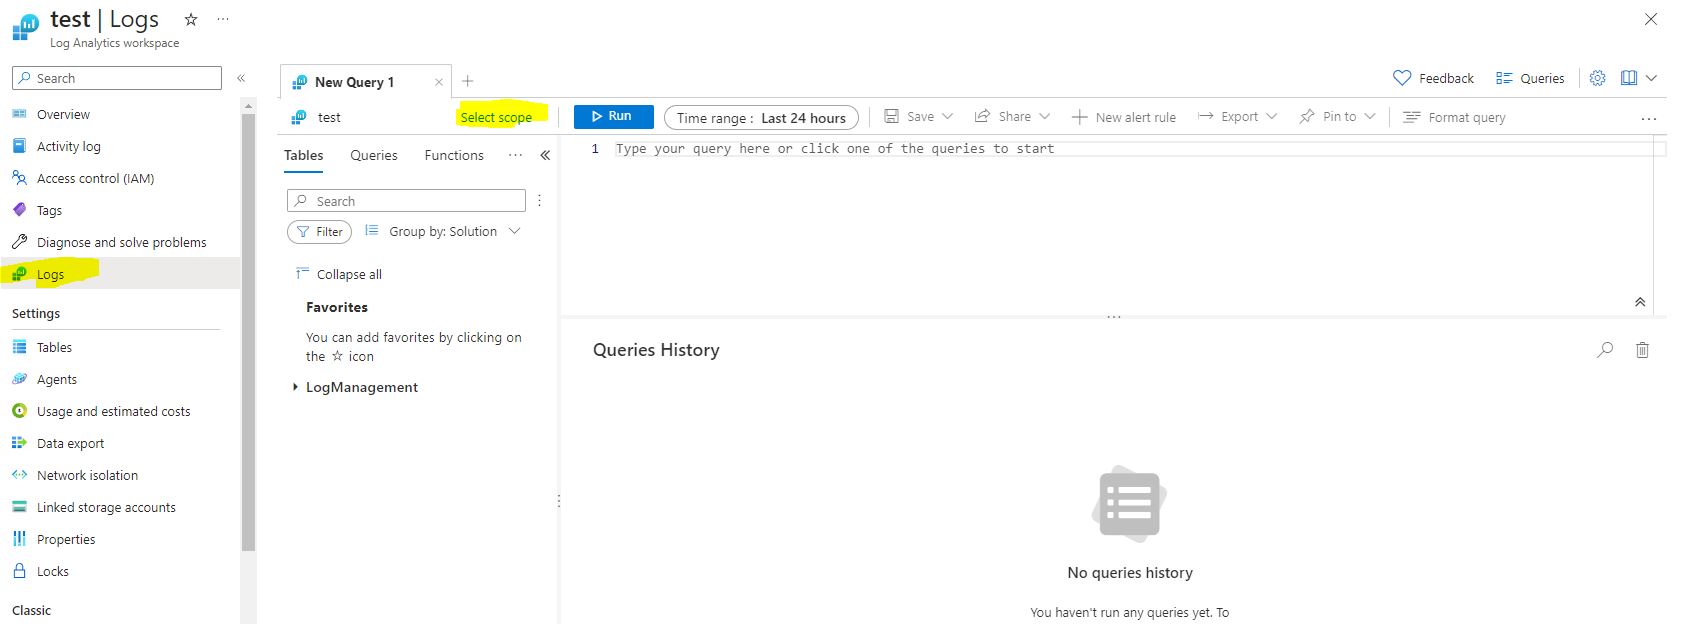
We can test that VM activity is being exported successfully by running a simple VM check.
AzureActivity
| where TimeGenerated > ago(1d)
| where OperationNameValue has “Microsoft.Compute/virtualMachines/Start/action”
and ActivityStatusValue has “Start”
AzureActivity Table is being exported from our Diagnostic Settings. Once the logs are exporting correctly, you should see some results. Note, if you do not have any test/dev environments where VMs are powered on and off more frequently, switch subscriptions, resource group, or find a different query that would produce results for you.

If you expand the item, this will show tons of information.

Now, since we know we’re getting information, let’s setup the much needed VM Availability Alert. We’re going to be querying the HeartBeat Table. The starting query will be a VM in the subscription that has not sent a check-in for over 5 minutes. The date range will only go back 24 hours. I also strongly suggest this be scoped to a production level resource group when it comes time to create the alert. If this is scoped too wide (Test and Dev), too many alerts could create “alert fatigue” with staff.
Heartbeat
| where TimeGenerated > ago(24h)
| summarize LastCall = max(TimeGenerated) by Computer, _ResourceId
| where LastCall < ago(5m)
Once you have the KQL written, run it to make sure there are no errors. If you need to expand the time to test results, please do say. Change the 24h to 3d, or 5d. However, do not leave that number for the alert. Once you are satisfied, select “New Alert Rule”.

The query will be loaded into the next screen and this is where we can make our adjustments. I set TimeGenerated > ago (3h). This is because the action we are going to stack on this will send an alert every 5 minutes while this server is down. Basically, you want to create your age out policy. If someone can’t bring the server up or disable the alert, how long do you want to keep receiving alerts? If that number is an hour, then set it to an hour. This is your environment, set it according to what you want.

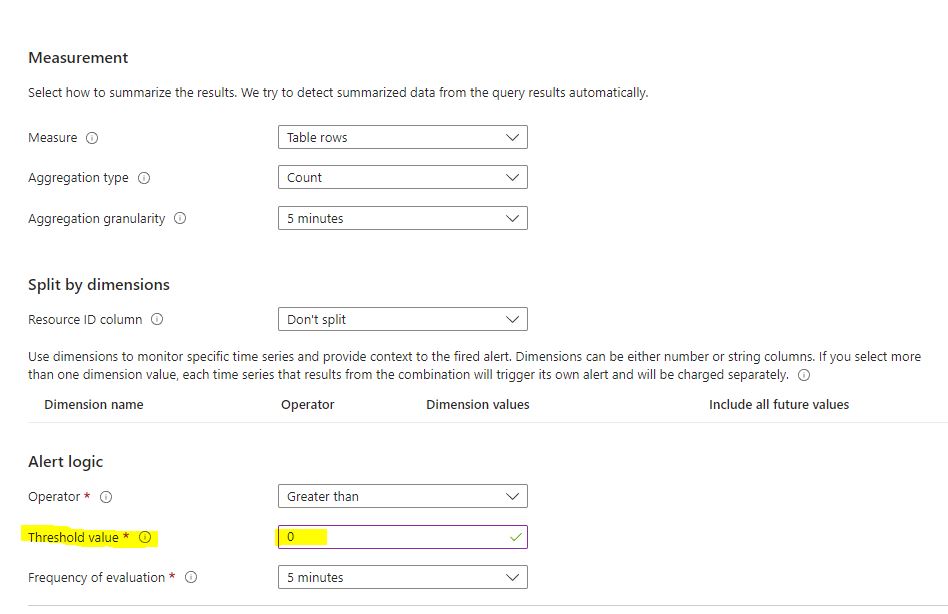
Set your threshold value to 0 down below, then select next (Actions).
If you already have an Action Group created you want to use; great, use that one. If not, create a new one here. If you want to send SMS alerts out or e-mails, decide that here. This will be your type of response and to who. Here’s a little snip of that area. Just make sure to put something under name when you are done.

When finished with Action Groups, select next and setup the Details section. I recommend a meaningful alert because the Alert Rule Name will be included with the message. This will help team members discern the issue quicker. Since this is a production server going down, I would also file this as critical.
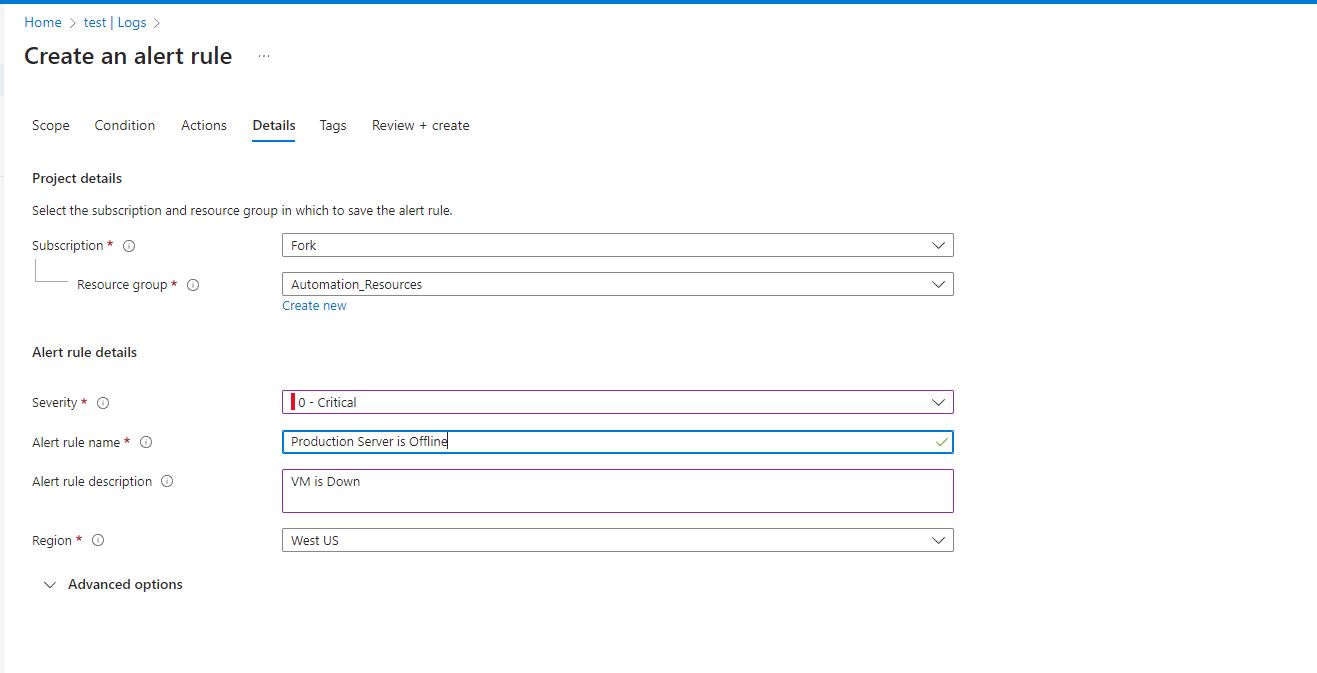
There is one section under advanced that I think is worth considering. Mute Actions will halt further notifications for a desired amount of time. This can be helpful to not inundate staff every 5 minutes with an alert like this (or overflow their text messages or emails). You could set this to 5 minutes, and the notification will trigger every 10 minutes–as opposed to every 5.
Select next. Add tags if you want. Then review and create. If everything checks out, Congratulations. You’ve created an alert to notify you–or staff members–that a VM went offline. If you spend some time in Log Analytics, you’ll see there are tons of canned queries and lots of ways to create alerts. Set up what’s right for your environment and adds proactive value. Here’s a few I setup to keep tabs on our production environment:
https://github.com/Happy-Hooligan/KQL-and-Alerts/tree/main
//Azure VM has been started
AzureActivity
| where TimeGenerated > ago(1d)
| where OperationNameValue has “Microsoft.Compute/virtualMachines/Start/action”
and ActivityStatusValue has “Start”
//Azure VM has been deleted
AzureActivity
| where TimeGenerated >= ago(1d)
| where OperationNameValue has “Microsoft.Compute/virtualMachines/delete”
and ActivitySubstatusValue has “Accepted”
//Azure VM has been created
AzureActivity
| where TimeGenerated >= ago(1d)
| where OperationNameValue has “Microsoft.Compute/virtualMachines/write”
and ActivityStatusValue has “Start”
//Azure VM has not sent a heartBeat in over 5 minutes
Heartbeat
| where TimeGenerated > ago(24h)
| summarize LastCall = max(TimeGenerated) by Computer, _ResourceId
| where LastCall < ago(5m)
//Find all virtual disks that are unattached to a VM
Resources
| where type has “microsoft.compute/disks”
| extend diskState = tostring(properties.diskState)
| where managedBy == “”
or diskState == ‘Unattached’
| project id, diskState, resourceGroup, location, subscriptionId